分类:FOMC
Federal Open Market Committee meeting and announcement. Day traders should exit positions before the report and wait until at least 10 minutes after the report before trading again to allow for a trend to begin. From a research of all the FOMC days from 2018, market stays in trading range for around 72% of the days before the FOMC announcement at 2pm ET, see details in below table.
| Price action characteristics in 1st half day | Total number of days by category | Percentage of days by category | Dates (hover over to see 5 mins chart of the day) |
|---|---|---|---|
| Typical TR | 32 | 72% | 20180131, 20180502, 20180613, 20181108, 20190501, 20190619, 20190731, 20190918, 20191030, 20191211, 20200129, 20200610, 20200916, 20201105, 20201216, 20210127, 20210317, 20210428, 20210728, 20211103, 20211215, 20220126, 20220316, 20220504, 20220615, 20220817, 20220921, 20230201, 20230222, 20230322, 20230412, 20230503 |
| Bear trending TR | 1 | 2% | 20180801 |
| Bull trend (price well abvoe EMA for most time) | 8 | 18% | 20180321, 20180926, 20190130, 20200429, 20200729, 20210922, 20220727, 20221214 |
| Bear trend (price well below EMA for most time) | 3 | 7% | 20190320, 20210616, 20221102 |
| Total | 44 | 99% | NA |
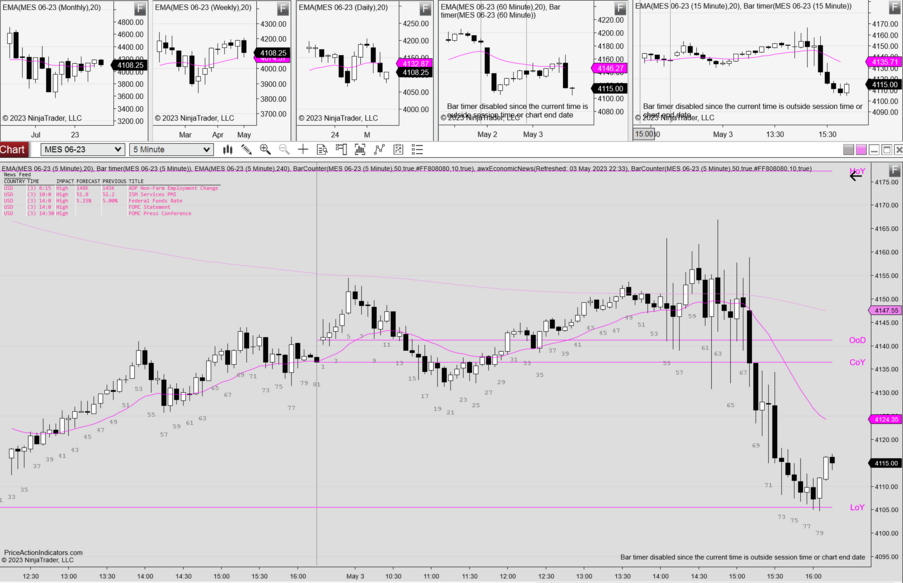
Above table listed all the FOMC days from 2018 to 20230503, out of the 44 days, 32 days had typical trading range price action before the FOMC announcement at 2pm ET, which is about 72%, knowing this can actually give traders more confidence to buy a reasonable bull reversal setup, or sell a reasonable bear reversal setup during the first half of a FOMC day, especially when there is a strong reversal signal appears within the first two hours. For example, on 20230503, knowing there are more than 70% chance the first half will be some kind of trading range day, traders can be confident to short below 6 after the BX 1-5, or buy above 21 for a WB or 25 for a HLMTR.
子分类
本分类有以下5个子分类,共有5个子分类。
F
分类“FOMC”中的页面
以下66个页面属于本分类,共66个页面。
2
- 20100127
- 20100316
- 20101214
- 20150617
- 20180131
- 20180221
- 20180321
- 20180502
- 20180613
- 20180801
- 20180926
- 20181108
- 20181219
- 20190130
- 20190320
- 20190501
- 20190619
- 20190731
- 20190918
- 20191030
- 20191211
- 20200129
- 20200429
- 20200610
- 20200729
- 20200916
- 20201105
- 20201216
- 20210127
- 20210317
- 20210428
- 20210616
- 20210728
- 20210922
- 20211103
- 20211215
- 20220126
- 20220216
- 20220316
- 20220504
- 20220615
- 20220727
- 20220817
- 20220921
- 20221102
- 20221214
- 20230201
- 20230222
- 20230322
- 20230412
- 20230503
- 20230524
- 20230726
- 20230816
- 20230920
- 20231011
- 20231019
- 20231101
- 20231109
- 20231121
- 20240131
- 20240320
- 20240501
- 20240918

