交易手冊:價格行為是遺傳基因決定的嗎?
https://www.brookstradingcourse.com/how-to-trade-manual/price-action-genetically-based/
價格行為是遺傳基因決定的嗎?
現在的圖表與100年前的一樣嗎?Charts are the same as 100 years ago
隨著計算機占據了交易的主導地位並且市場變得越來越國際化,一個常見的討論話題是市場行為是否發生了變化。圖表上的價格行為被認為是人類行為的一種反映。和所有的行為一樣,價格行為也具有遺傳基礎。人們一直都希望賺錢,而我們通過交易來實現這一目標。例如,當你去商店購買一個蘋果時,你實際上也是在做交易。
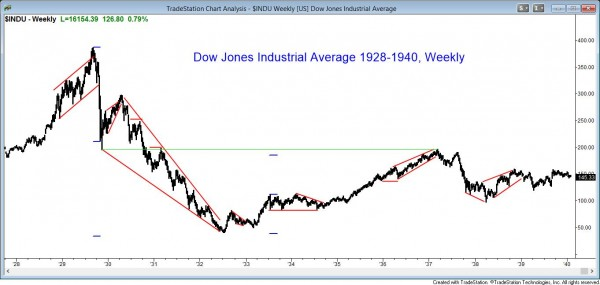
我從1987年已經開始交易。我還查看過100年的歷史圖表。如果我去掉圖表上的標籤,我就無法確定這張圖表是來自1910年還是2010年,也無法確定它是一個5分鐘的外匯圖表還是道瓊工業平均指數的月線圖表。
Now that computers dominate trading and markets are international, a common topic is whether the behavior of markets has changed. The movement on charts is called price action and it is a reflection of human behavior. Like all behavior, it is genetically based. People have always wanted to make money and we all do it by trading all day long. For example, when you go to the store, you trade money to get an apple.
I have looked at charts going back 100 years and I have traded since 1987. If I remove the labels from the charts, I cannot tell if the chart is from 1910 or 2010, and I cannot tell if the chart is a 5 minute Forex chart or a monthly chart of the Dow Jones Industrial Average.
計算機並沒有改變價格行為 Computers have not changed price action
儘管計算機的出現使交易更加自動化和高速化,但我認為程序演算只是尋找更加合乎邏輯的模式,然後構建能夠獲得數學優勢的交易。這正是所有交易者自有市場以來所做的事情。因此,雖然計算機在交易中扮演了更重要的角色,但它們並沒有改變價格行為的本質。價格行為仍然是人類行為的反映,也就是說,它們仍然遵循著相同的市場規律和趨勢。
How can computers not have affected the price action? It clearly has some effect, but I believe that algorithms simply look for logical patterns and then structure trades where there is a mathematical edge. That is exactly what all traders have done in all markets since the beginning of time.
交易具有一定的基因基礎 Trading is genetically based
在人類文明的歷史長河中,交易一直扮演著重要的角色,是人類生存和發展不可或缺的一部分。因此,能夠勝任交易的人具有更強的適應能力,而這些人的基因在長達數萬年的自然選擇過程中逐漸得到了優化,相比那些不擅長交易的人更具有競爭優勢。
因此,可以說交易能力在一定程度上基於個體的基因,而隨著計算機技術的進步,交易能力得以不斷提高,趨於更加完善。正因如此,即使是100年前的圖表與現在的圖表也沒有什麼差別,所有市場和時間周期的圖表看起來都類似,這種趨勢也將一直持續下去。
因此,可以說所有價格行為都有基因基礎,即使是由計算機進行的交易也不例外。對於經驗豐富的價格行為交易者來說,他們可以理解市場在每一個tick的運動情況。他們可以洞悉市場運動的規律,進而做出更為準確的交易決策。
Trading has always been part of civilization and crucial to survival. This means that the more fit traders have an advantage and that their genes have been naturally selected over those of incompetent traders for tens of thousands of years.
The result is that trading is genetically based, and computers simply move trading closer to perfection. This is why the charts are the same as they were 100 years ago and why the charts of all markets and all time frames look the same and always will.
All price action is genetically based, even if the trading is done by computer. A very experienced price action trader can understand what the market is doing during every tick during the day.

所有市場和時間周期的圖表價格行為都是相同的。Charts are the same in all markets and time frames
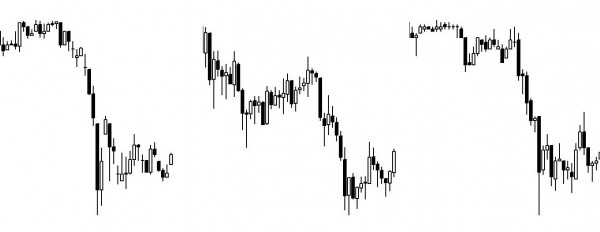
舉個例子,看一下上面的三張圖表。我隱藏了它們的時間和價格軸,以說明它們的相似之處。你能分辨出哪一個是黃金期貨圖表、哪一個是EURUSD外匯圖表,哪一個是通用電氣的圖表嗎?此外,你能辨認出哪個是1987年股市崩盤期間的日線圖、哪個是1分鐘圖,哪個是5分鐘圖嗎?[1]
For example, look at the three charts below. I hid the time and price axes to illustrate this point. Can you tell which is a gold futures chart, a EURUSD Forex foreign exchange chart, and a chart of GE? Also, which is a daily chart during the 1987 stock market crash, a 1 minute chart, and a 5 minute chart?
所有時間周期都有相同的價格行為 All time frames have the same price action
很多交易者不能整天觀察市場,而是使用60分鐘或日線圖進行交易。雖然我課程中的大多數例子都是基於5分鐘圖的,但也有很多使用日線、周線和月線圖表的例子。
例如,請看我在網站上發布的https://www.brookstradingcourse.com/free-sample-price-action-trading-videos/,其中有詳細的例子展示如何在周線外匯市場進行價格行為交易。
價格行為交易者應該相信市場是分形的(Price action traders believe that markets are fractal. ),這是指更大的時間周期級別的圖表形態由一系列更小的時間周期的圖表形態組成,無論您檢查多麼小級別的圖表,您都會看到與月線圖表上相同的模式。也就是說,市場中的價格行為是相似的,這意味著價格行為的交易策略可以應用於各種時間周期,從而提供了更廣泛的交易機會。
如果您看到一個類似上方圖表,沒有右側價格軸和底部時間軸的圖表,您就無法確定它是5分鐘、60分鐘、日線、周線還是月線圖表,也無法確定它是由多少個交易或股票組成的。這是因為圖表反映的是人類行為,而人類行為是基於基因的。不同的時間框架只是對人類行為的不同聚合方式。更高時間框架的圖表僅僅是更大規模的人類行為集合,而不是完全不同的行為類型。因此,沒有時間和價格軸的圖表只能表達出人類行為的模式,而無法確定其具體的時間和規模。
Many traders cannot watch the market all day long and instead trade using 60 minute or daily charts. Although most of the examples in my course involve 5 minute charts, there are many that use daily, weekly, and monthly charts as well.
For example, look at Module 43, which I have posted on the site in its entirety for free. There is a detailed example of how to trade a price action trade in the weekly Forex foreign exchange market.
Price action traders believe that markets are fractal. This means that bigger patterns are composed of a collection of smaller patterns, and no matter how tiny a chart you examine, you will still see the same patterns that you see on monthly charts.
If you look a chart like the ones above where there is no price axis on the right and no time axis below, you would not be able to tell if it was a 5 minute, 60 minute, daily, weekly, or monthly chart, or a chart made of 1,000 ticks or 50,000 shares. Why is that? Because charts simply represent human behavior, which is genetically based, and a higher time frame chart is just a bigger collection of behavior.
在所有市場和時間框架中採取相同的交易策略 Trade all markets and time frames the same
大多數價格行為交易者會以相同的方式交易所有的圖表(顯然會根據他們對於任何一筆交易的最大風險進行調整倉位大小、風險和獎勵),在你學會如何交易之後,你很可能也會這樣做。"
你經常在電視上看到這種情況。專家會展示日線、周線和月線圖表,並使用相同的術語來描述它們。他們尋找趨勢、交易區間、支撐和阻力,而不考慮時間框架。
當我交易60分鐘或日線圖表時,我使用與5分鐘圖表相同的分析方法。但是,當我需要持有的交易倉位長達數天或數周時,通常會使用期權來減少(限制)我的風險。
Most price action traders trade all charts the same way (obviously adjusting position size, risk, and reward, based on their usual maximum risk for any trade), and you probably will as well after you learn how to trade.
You see this on television all the time. An expert will show daily, weekly, and monthly charts and use the same words to describe them. He looks for trends, trading ranges, support, and resistance, and does not care what the time frame is.
When I trade the 60 minute chart or a daily chart, I use the exact same analysis that I use on a 5 minute chart. However, when I hold trades for days to weeks at a time, it is usually in the form of options because I want to contain my risk.
高頻交易並不是問題。High frequency trading are not a problem[2]
一些高頻交易機構因其驚人的盈利能力而受到廣泛關注,以至在交易者中開始出現使用越來越小的時間框架的趨勢,而且我注意到一些人正在推廣這些圖表作為交易者賺錢的一種方式,但我強烈建議,如果交易者使用過小的時間框架,大多數交易者只會長期虧損而不是獲利。我在課程中詳細講解了其中的原因,但其中最根本的一個原因是這些圖表無法給交易者足夠的時間清晰地思考,結果導致實際交易中犯了太多的錯誤。所以,從5分鐘圖表開始學習交易對初學者是個不錯的選擇,我建議交易者避免使用任何時間框架小於3分鐘的圖表。[3]
With High Frequency Trading firms getting so much press because some are incredibly profitable, there is a tendency among traders to move toward smaller and smaller time frame charts. I have noticed that there are several people promoting these charts as a way for traders to make money.
I strongly believe that most traders will only lose and never win long-term if they use very small time frames. I address the reasons in the course, but the most fundamental one is that these charts do not give traders enough time to think clearly and they end up making too many mistakes. A 5 minute chart is a good place to start, and I recommend avoiding any chart where there are more than 20 bars per hour.
季節性趨勢 Seasonal tendencies
當談到市場分析時,有一些季節性的趨勢是可以用統計數據來證明的。[4]因此,當季節性趨勢變得顯著時,我有時會在交易室中提及它們。[5]
例如,在一月份,華爾街有一種傳統,認為新年伊始所發生的事情具有重要意義。交易員喜歡將一月份視為一個股市晴雨表,並尋找關於新一年的漲跌的統計數據,基於一月份發生的情況來預測新一年的漲跌情況。雖然這些統計數據是有效的,但它們並不能幫助交易員構建良好的交易策略。
There are some seasonal tendencies that can be shown statistically. I sometimes bring them up in the trading room at the appropriate time of the year.
For example, during January, there is a tradition on Wall St. to find significance in what happens early in the year. Traders like to think of January as a barometer and look for statistics about whether the new year will be an up or down year based on what happens in January. Although the statistics are valid, they do not help in structuring trades.
我對一月份的觀察清單 My list of January observations
每年的年線平均有67%的概率收盤價高於開盤價,只有33%的概率會下跌。如果1月份的前五個交易日的K線總體為上漲,那麼1月月線上漲的概率為76%。然而,所有月份K線上漲的概率都為65%,因此這只是具有一個小幅的促進作用的開端(開局)。但如果它有一個良好的開局,整個年度上漲的概率更大也就有了合理的解釋。
如果一月份前五個交易日K線總體為下跌,那麼1月月線下跌的概率為60%,而不是35%。
如果1月價格總體上漲,則全年上漲的概率為82%,從二月到十二月的平均收益為8.5%。這是合理的,因為該年本來就有67%的機會上漲,這又是一個良好開端(開局)增加整個年度上漲概率的例子。
如果1月價格總體下跌,那麼從二月到十二月的平均收益僅為1.7%,而全年價格總體下跌的機會為58%,而不是通常的33%。
- On average, every year has a 67% chance of closing above where it opened and only 33% chance of being down.
- If the 1st 5 days of January are up, January is up 76% of the time. However, all months are up 65% of the time, so this is only a small improvement. If it has a head start, it makes sense that the odds for the entire year being up are better.
- If the first 5 days are negative, Jan is down 60% of the time, instead of only 35%.
- If January is up, the year is up 82% of the time, and the average gain from February to December is 8.5%. This makes sense since the year has a 67% of being up anyway, and this is another example of a head start increasing the odds for the entire year.
- If January is down, the average gain from February to December is only 1.7%, and the year has a 58% chance of being down, instead of the usual 33%.
其他日期的趨勢傾向 Other calendar tendencies
「Sell in May and go away」(五月平倉再遠走高飛)是一句至今仍然可靠的諺語。股市大多數的收益都在十月到四月之間實現。
股市有一個「七月四日」上漲的傾向(即在美國國慶節),但這更可能是第二季度的結束所帶來的影響。在6月26日至7月6日期間,歷年有75%的時間出現了反彈行情,其中最佳的時間是6月30日至7月5日。
九月份是債券和標普指數最疲軟的月份。然而,平均而言,九月份只比其他月份差1%,而這1%的跌幅可能會在一天內出現。這意味著大部分日子和全年其他時間一樣。
市場往往會在勞動節前後反彈,特別是從8月30日至9月5日。
Sell in May and go away」 is an adage that is still reliable. The stock market makes most of its gains from October through April.
There is tendency to get a rally at the 4th of July, which might be more due to the end of the 2nd quarter. The period between June 26 and July 6 has a rally 75% of the time, and the best is June 30 to July 5.
September is weakest month for bonds and S&P. However, on average, it is only 1% worse than other months, and that 1% can come in a single day. That means that most of the days are like those during the res of the year.
The market tends to rally around Labor day, especially from August 30 to September 5.
十月和第四季度 October and the 4th quarter
10月份有時會出現像1929年和1987年那樣的大跌。不過,即使有劇烈的拋售,它通常也會有強勁的收盤表現。11月5日的收盤價在95%的時間裡高於10月26日的收盤價。
這在一定程度上是因為這是公募基金的年底,基金會購買股票使其組合看起來更好。這被稱為櫥窗裝飾。基金經理希望確保季度報告顯示該基金在季末擁有所有最佳股票。
這使得他們有合理的推諉之詞,因此當有人批評他們的業績不佳時,他們可以聲稱他們擁有正確的股票,但是隨機波動導致了他們的業績不佳。
「感恩節屬於空頭,聖誕節屬於多頭」這句諺語是不可靠的。
在選舉年份,即使只有國會選舉,大部分漲幅都會在最後1,2周內出現,即從9月中旬開始。而一年中的大部分時間通常都處於一個交易區間。
October sometimes has big down moves like in 1929 and 1987. However, it usually closes strong, even if there is a sharp selloff. The close on November 5 is above the close of October 26 about 95% of the time.
This is in part because it is the end of the year for mutual funds and the funds buy stocks to make their portfolios look good. This is called window dressing. Fund managers want to make sure that the quarterly reports show that the funds owned all of the best stocks at the end of the quarter.
This gives them plausible deniability so that when someone criticizes their bad performance, they can claim that they had the right stocks, but random fluctuations created their bad performance.
The adage 「Thanksgiving is owned by the bears and Christmas by the bulls」 is not reliable at all.
In election years, even only congressional elections, most of the gains occur in the final 12 weeks, starting in mid-September, and most of the year is usually a trading range.
Dogs of the Dow(道指之犬)股息收益率最高的十個成分股通常被稱為道指之犬[6]
「Dogs of the Dow」理論認為,交易者應該購買去年股息最高的道瓊工業指數的股票,這是一種價值投資。交易者押注最差的30支道瓊股票會在今年追趕業績表現最好的股票。但是,這並不可靠,(有一句古話叫做「一分錢一分貨」)你所付出的代價就會對應你所獲得的回報。如果你買入了一個遭受重創的股票,並付出較少的代價,那麼你所獲得的回報也會較少。[7]
The Dogs of the Dow theory says that traders should buy last year’s Dow stocks with the highest dividends. This is a value trade. Traders are betting that the worst Dow 30 stocks will catch up to the great performers this year. This is not reliable, and you get what you pay for. If you are paying little, buying a beaten down stock, you are getting little.
- ↑ 事實上,由於價格行為的本質相同,這些圖表幾乎無法區分。Charles
- ↑ 聯繫全文,我感覺這裡翻譯的並不好
- ↑ A 5 minute chart is a good place to start, and I recommend avoiding any chart where there are more than 20 bars per hour. 這裡翻譯卡殼了,有點轉不過來,等待你們的意見
- ↑ 這些季節性趨勢在不同的時間段會有所不同,例如,在某個季節股市可能表現更強勁,而在另一個季節商品市場可能更具優勢。Charles
- ↑ 以便我們可以在交易決策中考慮這些趨勢。Charles
- ↑ 這裡是我去搜wikipedia後添加的。又通過其他網站了解到這個術語用於描述一種投資策略,即在每年的年初,選擇前一年道瓊指數表現最差的十支股票進行投資,認為它們在新的一年中有可能反彈。
- ↑ 另外,還有一句古詩可以形容這個道理,出自唐代詩人李商隱的《無題》:「莫道不消魂,簾卷西風,人比黃花瘦。」意思是說,不要說自己的心靈不為所動,就像黃花那樣的瘦弱,只有花開得艷麗,才會有風來吹拂。這同樣說明了,如果你所付出的代價很少,那麼你所得到的回報也會很少,只有你不斷地付出努力,才能換來更好的回報。
